The air of Lecce: visualizing air quality data
As a participant in the Lecce Open Data Contest, I developed a web application that visualizes the air quality data of the city.
Recently, I stumbled upon the Lecce Open Data Contest, a competition for developers to create innovative apps using public data released by the Municipality of Lecce.
Open data is openly accessible data, shared under an open license, which is a fantastic initiative by the municipality to increase transparency and encourage citizen participation.
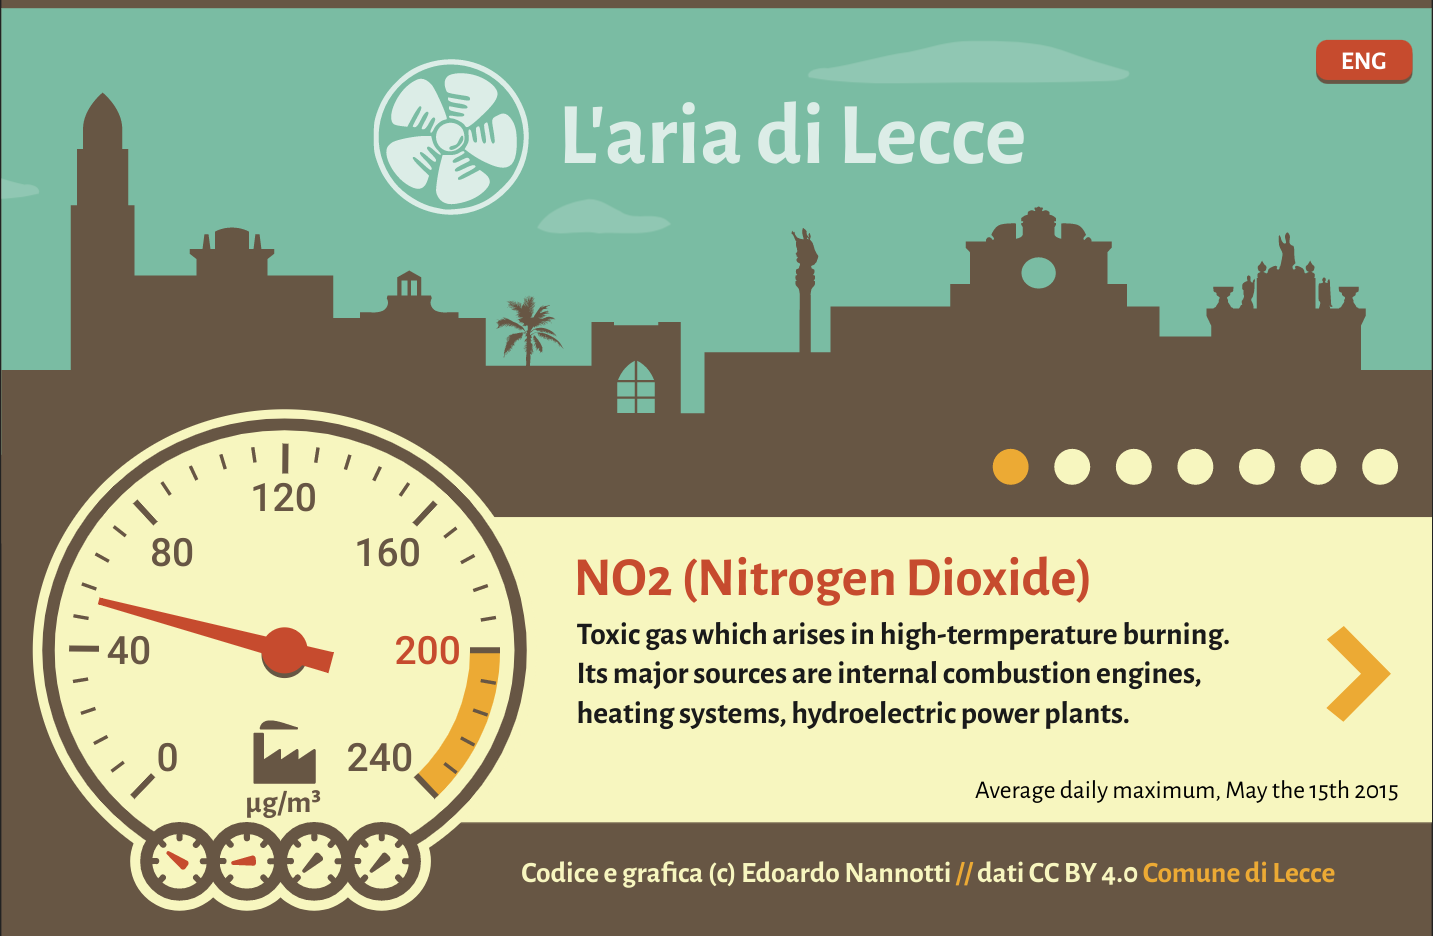
I decided to participate in the contest with a web application that provides an interactive and animated visualization of the latest air quality data of the city of Lecce using the open data issued by the municipality. The web app features an analog-style display that shows the current pollution levels in relation to the set limits, and users can explore data from various monitoring stations.
My goal was for the final product to not only be informative but also visually appealing, featuring a pleasant color palette and a stylized representation of the historical city center of Lecce.
To make this web app, I used python to fetch the latest data from the portal and Snap for the Svg animations.
I'm happy to have participated in the contest and built something nice!
The app is available at lariadilecce.undo.it.